Medical data visualization
We understand how important data visualization is.
Thanks to our competencies and experience you may explore data and get insight into real value embedded in medical images.
Why data visualization
New imaging biomarkers
Medical images contain a much greater amount of information than used today. It becomes a significant challenge when it comes to understanding and interpretation. The visualization of patient medical data can facilitate this task and provide new biomarkers that haven’t been available before. It provides not only morphological but also functional information. New biomarkers frequently aid in recognizing the disease in its earlier stages, even in the preclinical phase.
Clinical trials and research
Visual representation of clinical data is an effective tool for investigation and reaching well-informed decisions in clinical trials. Data visualization methods based on AI-enabled medical image segmentation and processing may improve the quality of data as well (higher objectivity, lower inter-observer variability and decrease of required sample size), resulting in cost reduction.

Medical education
Advanced data visualization plays an increasing role in medical education – especially anatomy, radiology and surgery education. It is being used more and more widely in the field of interventional and surgical training including simulators (with the use of physical and virtual 3D models). Data presented visually and interactively may then be investigated, analyzed, and transformed into knowledge or useful models.

Easier and faster diagnosis
3D/4D models enable better insight into complex anatomical structures. Technologies based on AI can recognize and segment not only entire objects that are the subject of analysis (e.g. organs, tumors) but also their parts (e.g. aorta, coronary arteries, plaques, liver segments, etc.). The visualization based on this work enables a very precise examination of the patient’s anatomy and reduces the time needed. Additionally, those techniques increase reproducibility between readers.

Treatment planning and decisions
Some new biomarkers become key parameters and help choose the best treatment option (e.g. pharmacotherapy, minimally-invasive intervention, surgical treatment) and optimal intervention timing. They play a vital role in the context of detailed treatment planning including radiation or invasive/surgical intervention (e.g. implant size, 3D printed personalized implant, optimal vascular access), enabling better risk assessment.
Treatment evaluation
Advanced visualization methods allow to have a clear understanding of the underlying data and better assessment of treatment effectiveness, evaluation of potential complications as well as early detection of relapse (comparison of follow-up studies).
Selected works
Cinematic volume rendering
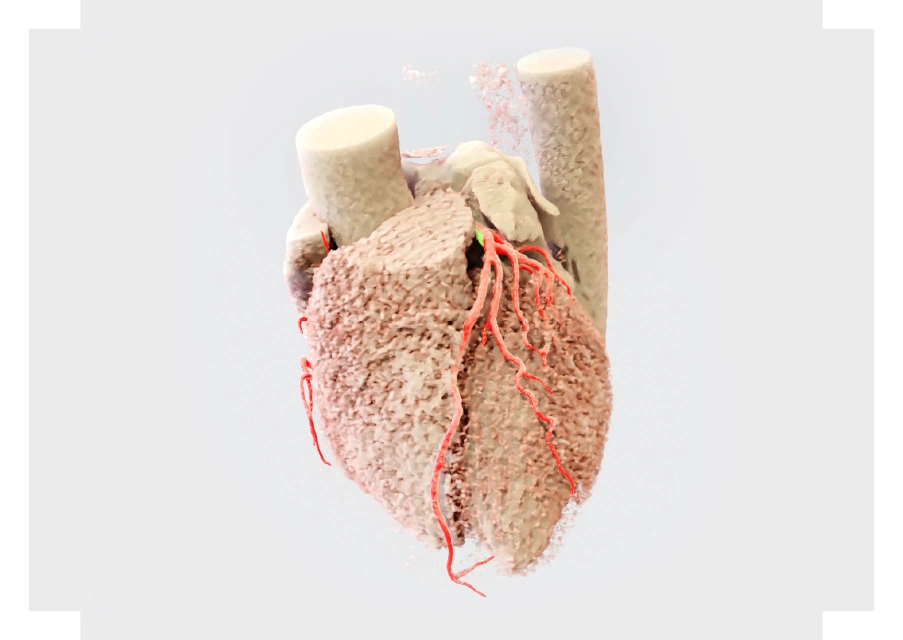
Cinematic volume rendering is a well-known data visualization technique, often used to present three-dimensional images (3D) of computed tomography.
An example shows how semantic segmentation helps to analyze images (3D) of computed tomography images.
Appropriate masking can be used to remove the heart, aorta and coronary arteries.
Visualization of dividing the pelvic area and spine into areas
Visualization of the effect of dividing the pelvic area and spine into 4 areas (sacrum, left ilium, right ilium, lumbar spine).
Imaging takes into account different types of fractures (fracture, fragmentation, displacement).
Interactive graphics – rotate, zoom in, zoom out.
Why Graylight Imaging
We’ve been working on interactive visualization tools for years. K3D-jupyter – a high-performance, open-source 3D visualization library for Jupyter notebooks, optimized to work with large volumes of data is co-created by Professor Marcin Kostur, Graylight Imaging’s Head of Technology.
We can help you with the automated segmentation of medical images. The accuracy of our work might be proven by the fact that the algorithm created by our team was top-ranked in Brain Tumor Segmentation Challenges, as well as by the satisfaction of our clients.
We offer help for the entire end-to-end data processing chain, starting with the capture of the data and continuing through its processing, analysis and extraction of valuable and quantifiable information.
Our engineering, medical, and scientific teams have vast experience in quantitative imaging and radiomics. Our projects, by using custom medical imaging algorithms, empower medical professionals with a more accurate view of a disease condition.
Learn more about our competences
Let’s work on your challenges together!

Contact us:

Let’s work on your challenges together!
Contact us:
